
User Guide
ACE Daily tracks every daily race run on acevo.gg for Assetto Corsa EVO — results, lap times, Grid Rating and Safety Rating history — and turns them into leaderboards, statistics and pre-race tools you can't get from the site itself. Everything on this page reflects the app as it stands today; nothing here is official SimGrid/acevo.gg documentation.
As of this guide: 29,314 races, 219,109 results, 53 events and 25,881 drivers on record.
❓FAQ
The most common questions, in short.
Is this an official SimGrid, Kunos, or acevo.gg site?
No. ACE Daily is an independent, fan-made project, not affiliated with or endorsed by Kunos Simulazioni, SimGrid, or acevo.gg.
Where does the data come from?
Every result is collected automatically from acevo.gg, the platform that officially runs Assetto Corsa EVO's daily races. We don't run the races — we collect them and present them in a more useful way.
Is it free?
Yes, access is completely free.
How often is the data updated?
Results are checked automatically every few minutes — a race that just finished on acevo.gg shows up here shortly after.
Why can't I find my old username?
If you changed your nickname on acevo.gg (for example by adding a team tag), the system doesn't automatically link the old name to the new one — it treats them as two separate drivers. Races run under your previous name are still in the database, searchable separately under that name.
Why do some drivers have no Safety Rating?
acevo.gg itself doesn't assign (or show) a Safety Rating yet for drivers who haven't raced enough — it's not missing data on our end.
How reliable are Win Probability and Expected ΔGR in Race Prep?
They're estimates from a statistical model we reverse engineered ourselves from historical race data — not official SimGrid numbers. They explain roughly 57% of the observed variation: treat them as directional, not as predictions. Details in the "Race Prep" section below.
I found a data error or have an idea — where do I report it?
On our Discord channel — it's also the right place to request deletion of your own data.
1Home screen & filters
Every view starts here: pick an event and round, then choose what you want to see.
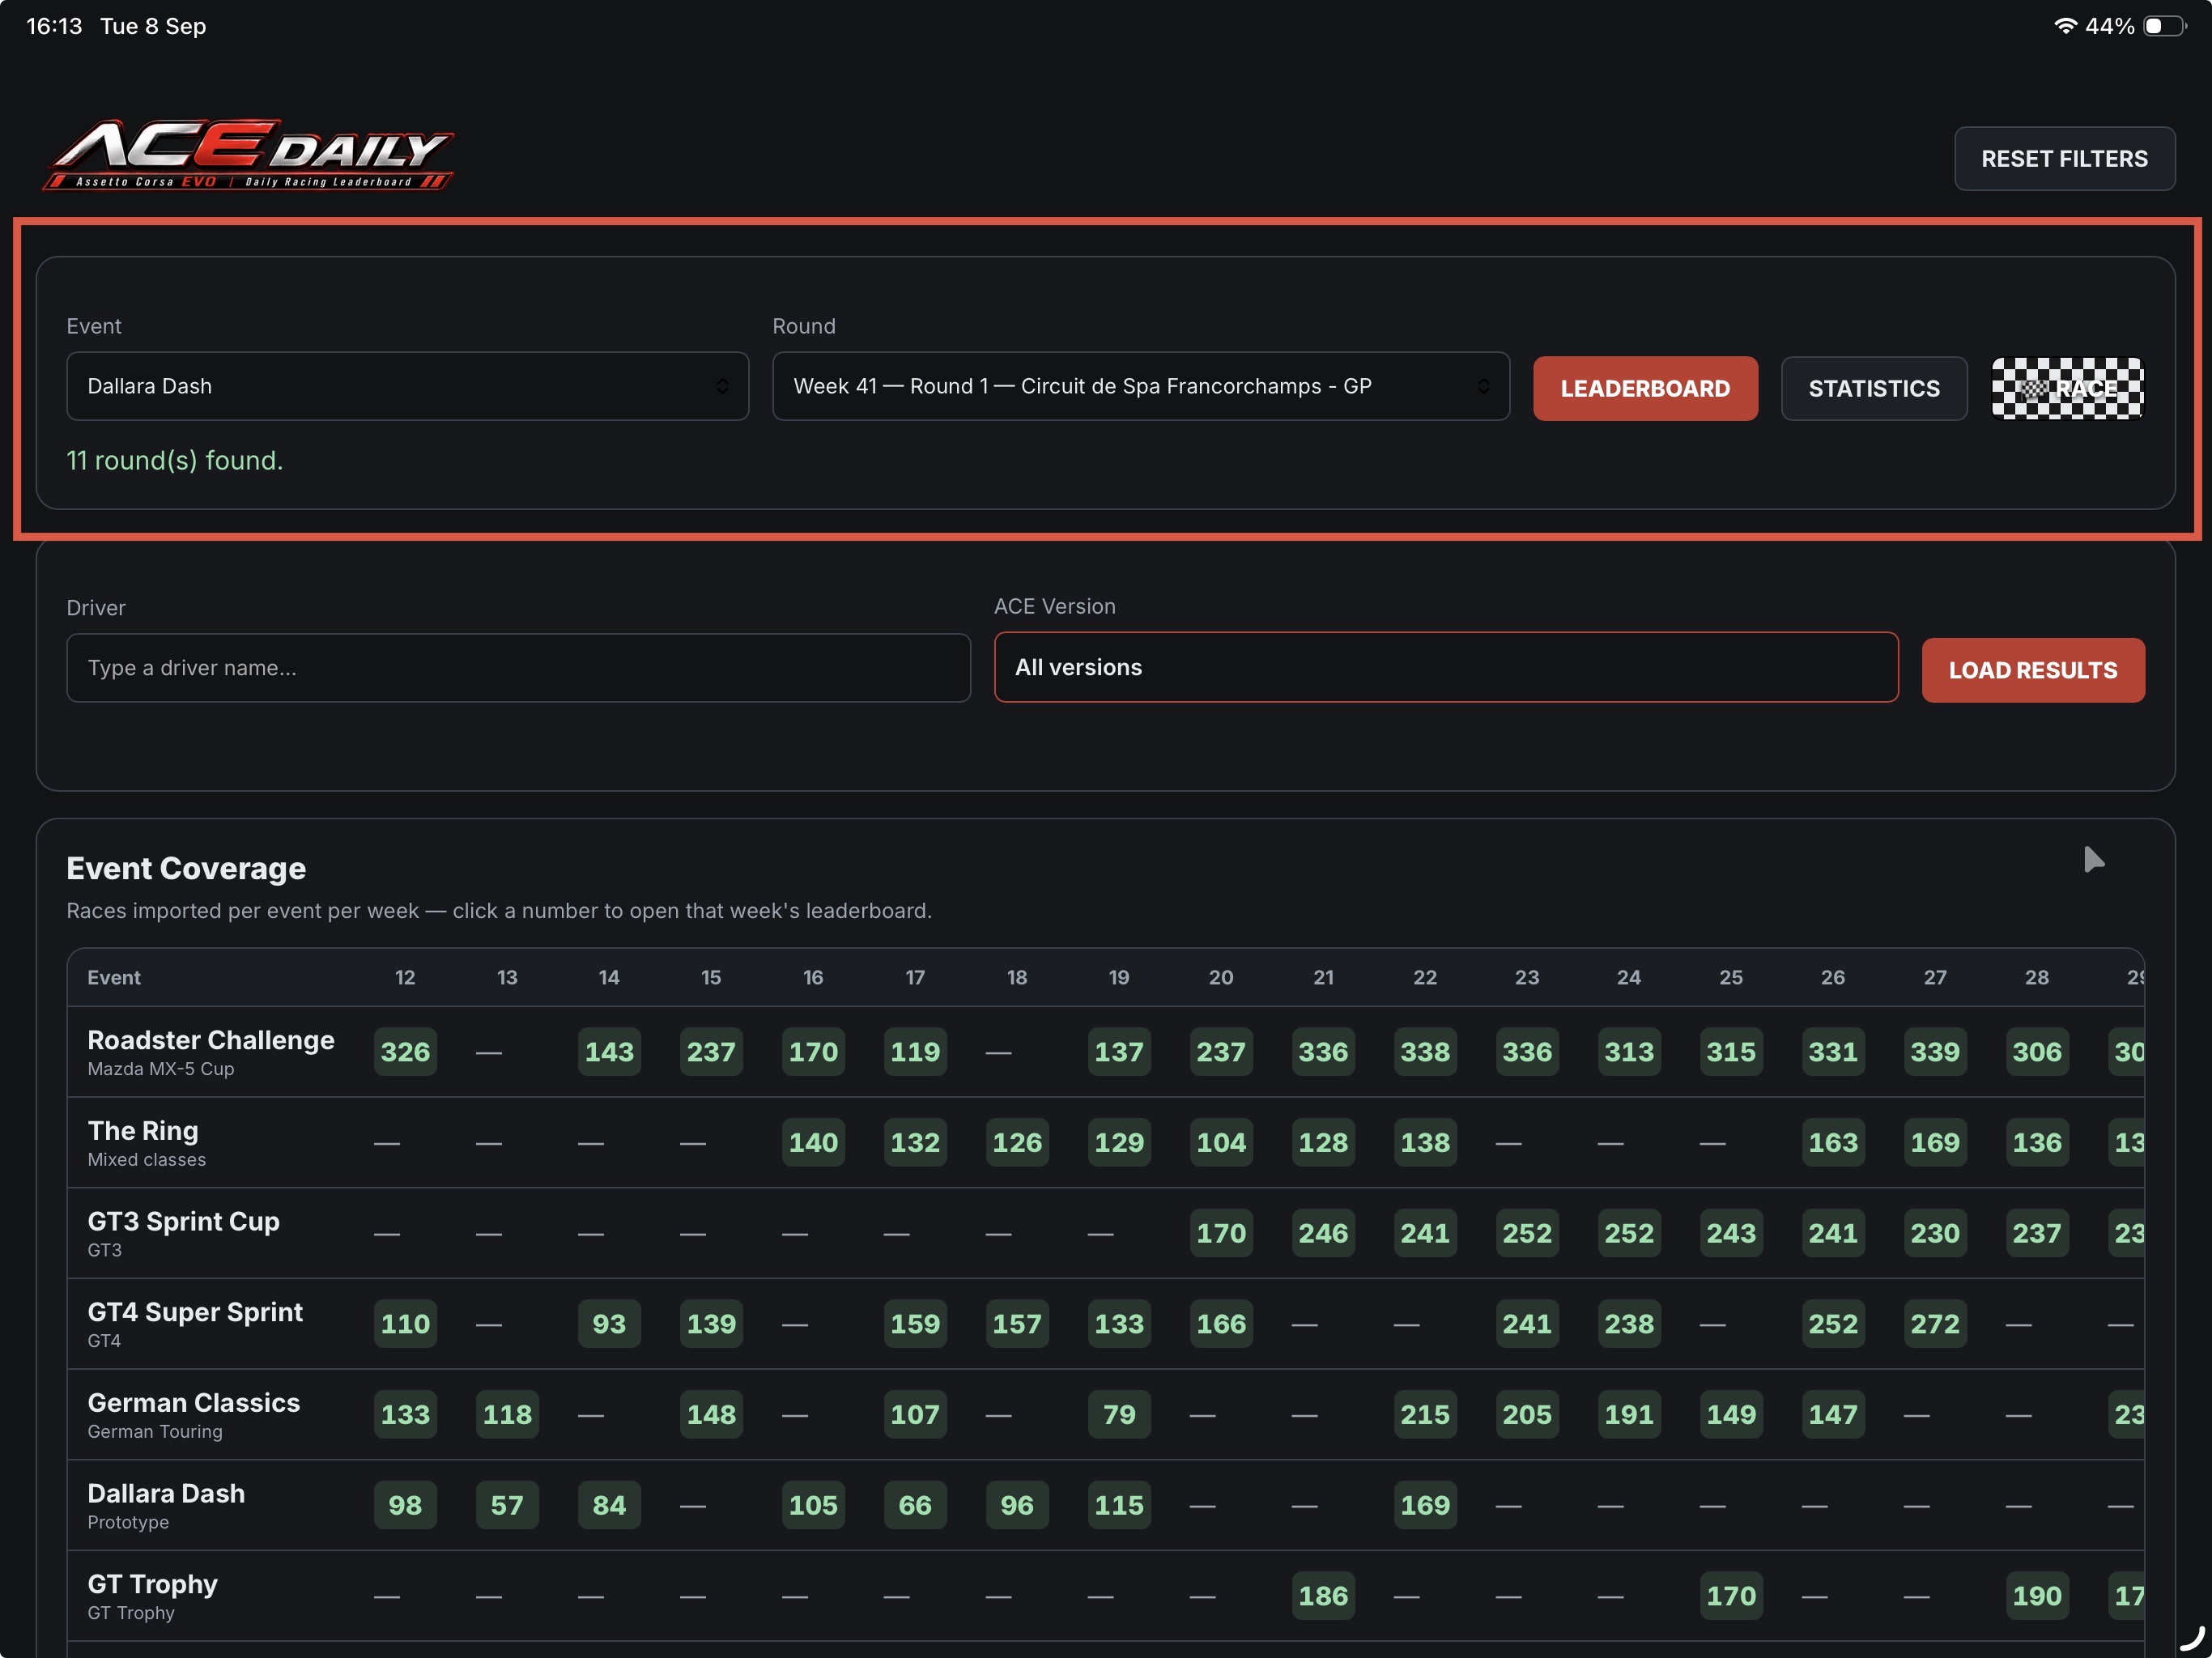
Event and Round narrow everything down to one week of one championship — the round dropdown lists every week on record for that event, labelled with its track. Once a round is selected, three buttons become available:
LEADERBOARD— best-lap ranking for that event/track/car combination (see below).STATISTICS— when during the week that event is busiest, and how strong the field tends to be.🏁 RACE— the pre-race prep tool: build tonight's grid and see win odds and expected Grid Rating change (see below).
Below that, a separate Driver search with an ACE Version filter opens a driver's full profile (races, ratings, wins, and a car×track rating matrix) — independent of the Event/Round pickers above it.
At the bottom of the home screen, the Event Coverage matrix gives an at-a-glance view of every event's history — how many races were imported each week, across every event at once (details further down).
2Leaderboard
The best lap set by every driver on the selected track, for the car class run that week.
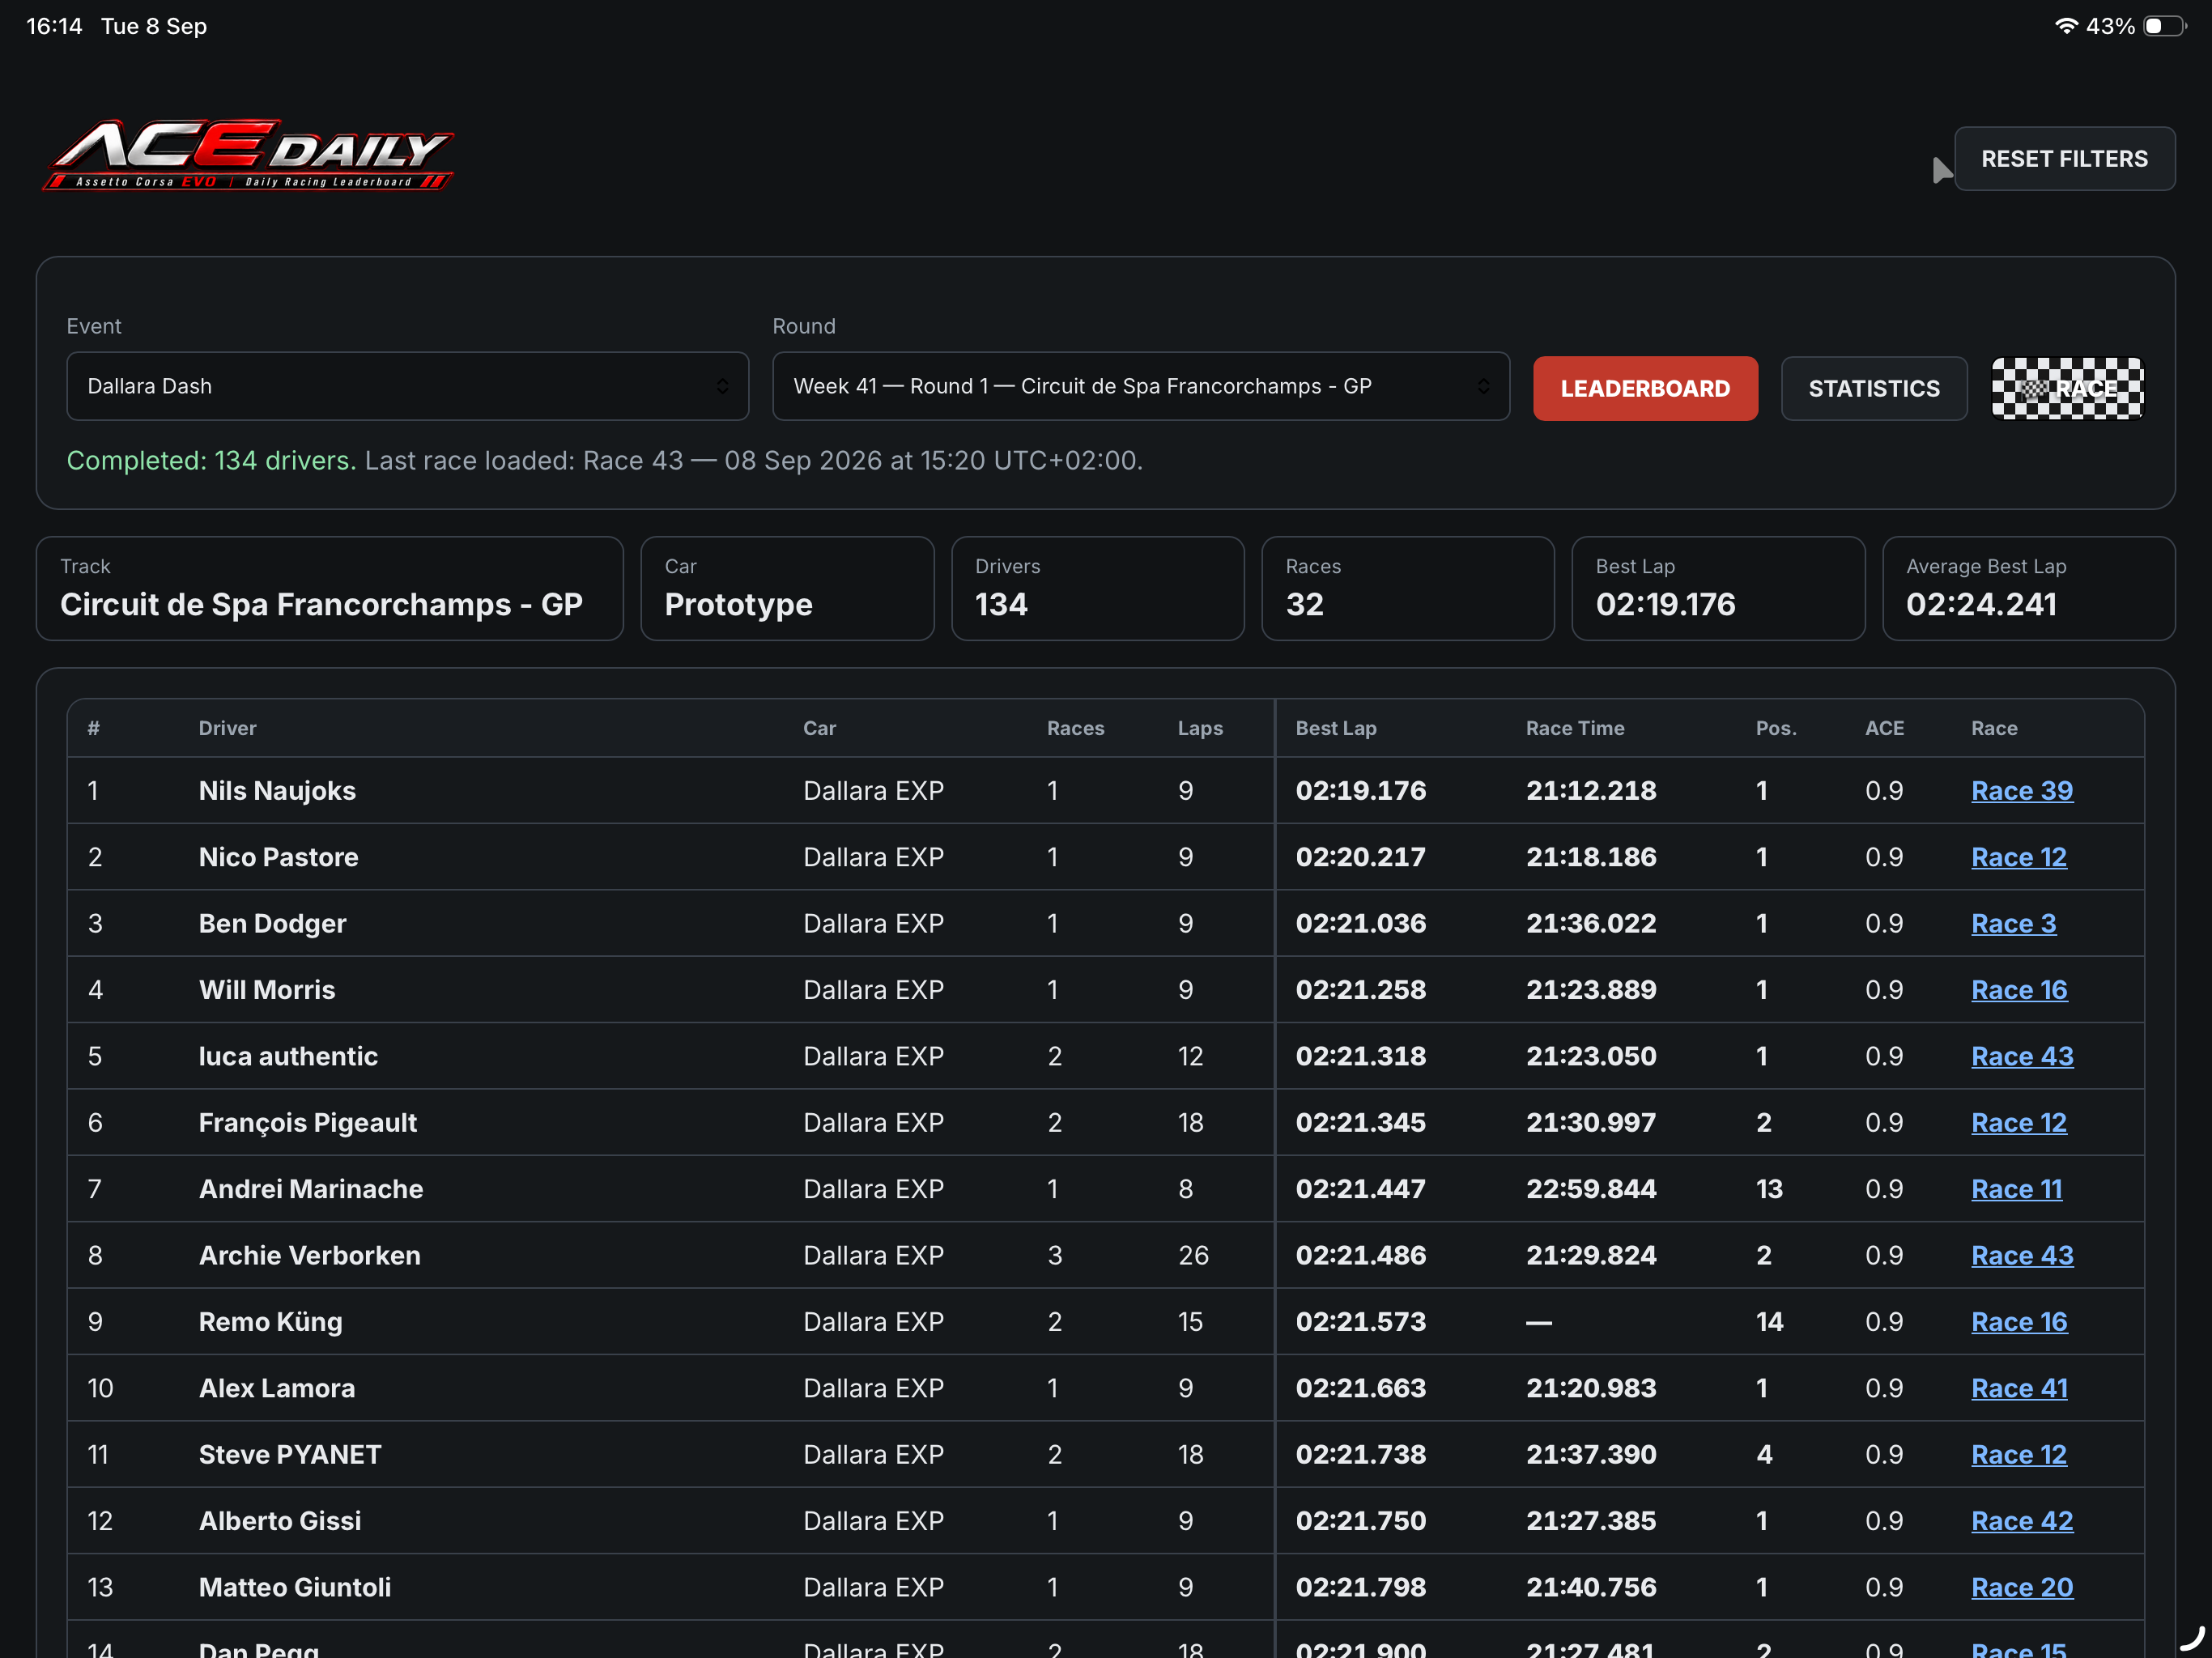
The stat cards summarize the field: track, car, number of distinct drivers, number of races run, the outright best lap, and the average of everyone's personal best lap.
The table below ranks every driver by their single best lap on that track+car — not by race result. Each row also shows their race count and total laps on this combination, their race time and finishing position in the race where they set that lap, their ACE game version, and a link to that specific race's results page on acevo.gg.
3Statistics
When is this event actually busy, and how strong is the field at that time?
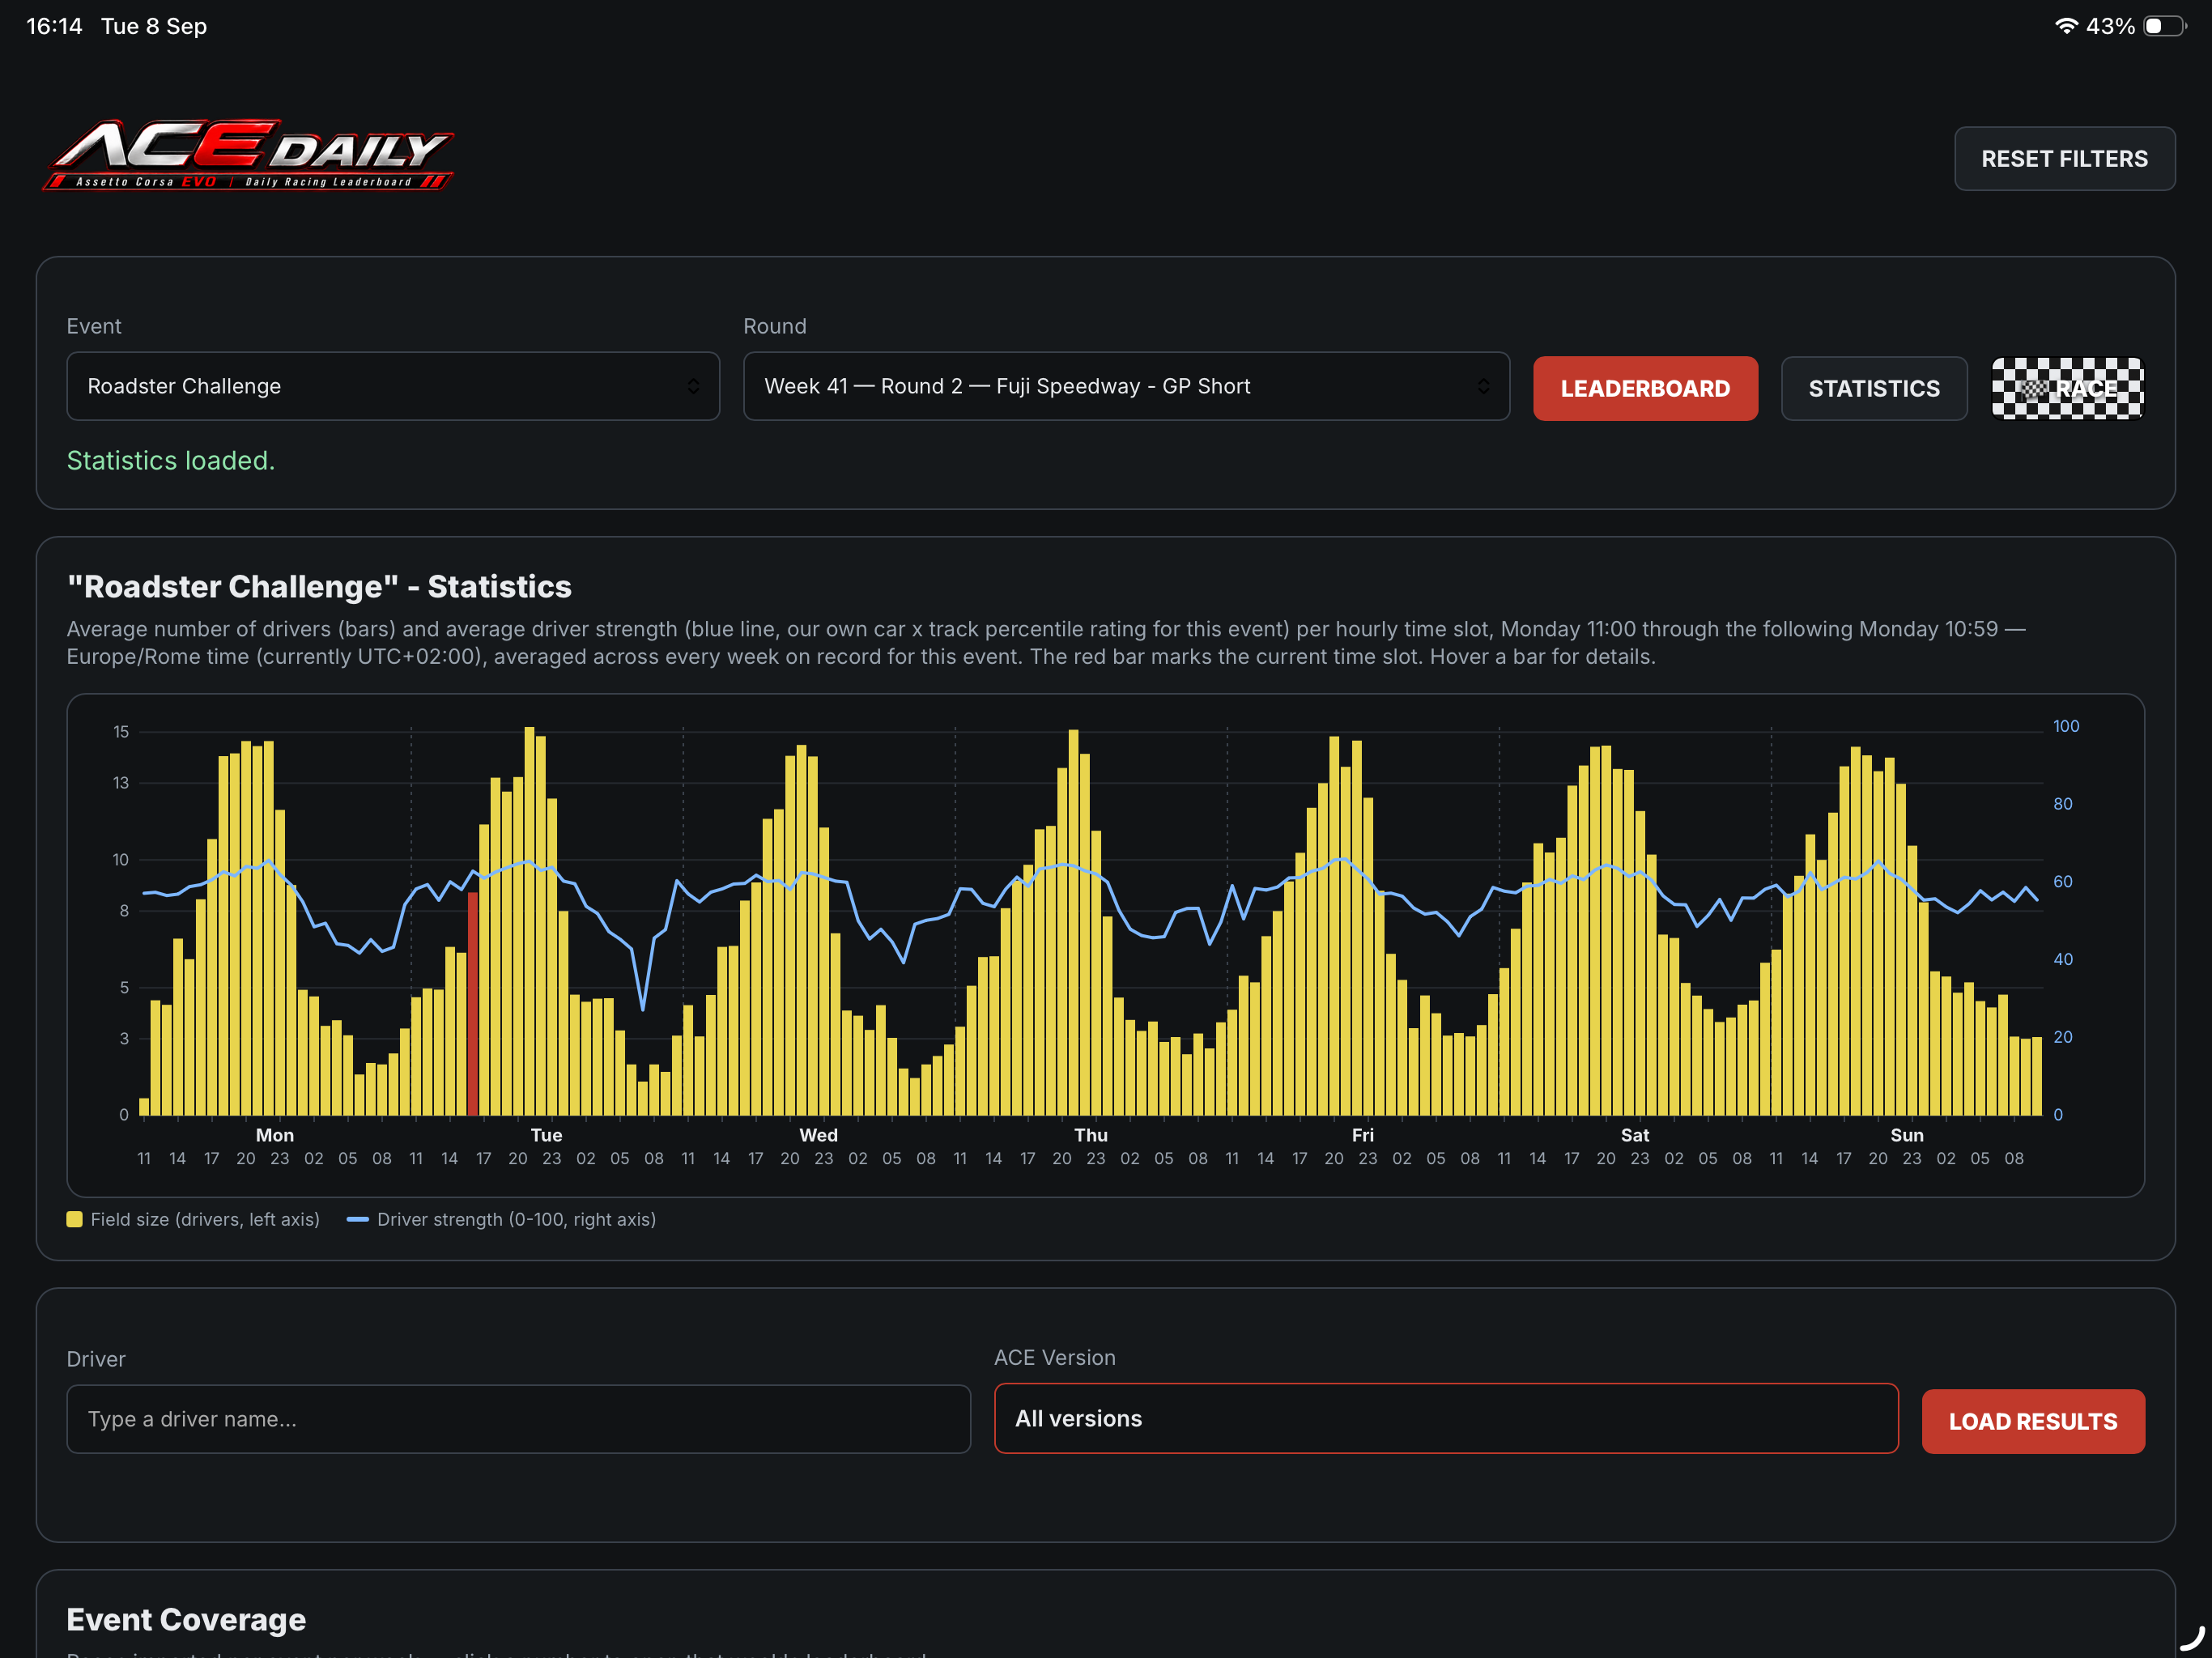
The chart plots, hour by hour from Monday 11:00 through the following Monday 10:59 (Europe/Rome time), averaged across every week on record for that event:
- Field size (yellow bars, left axis) — the average number of drivers racing in that hourly slot.
- Driver strength (blue line, right axis, 0–100) — the average car×track percentile rating of drivers racing in that slot (the same rating used in the Driver Profile matrix, see below).
The red bar marks the current time slot, so you can see at a glance whether right now is typically a quiet or a busy — and easy or tough — moment for this event. Hover any bar for the exact numbers.
4Race Prep ("RACE")
Built during practice, before the green flag: who's actually in tonight's race, and what should you expect from it.
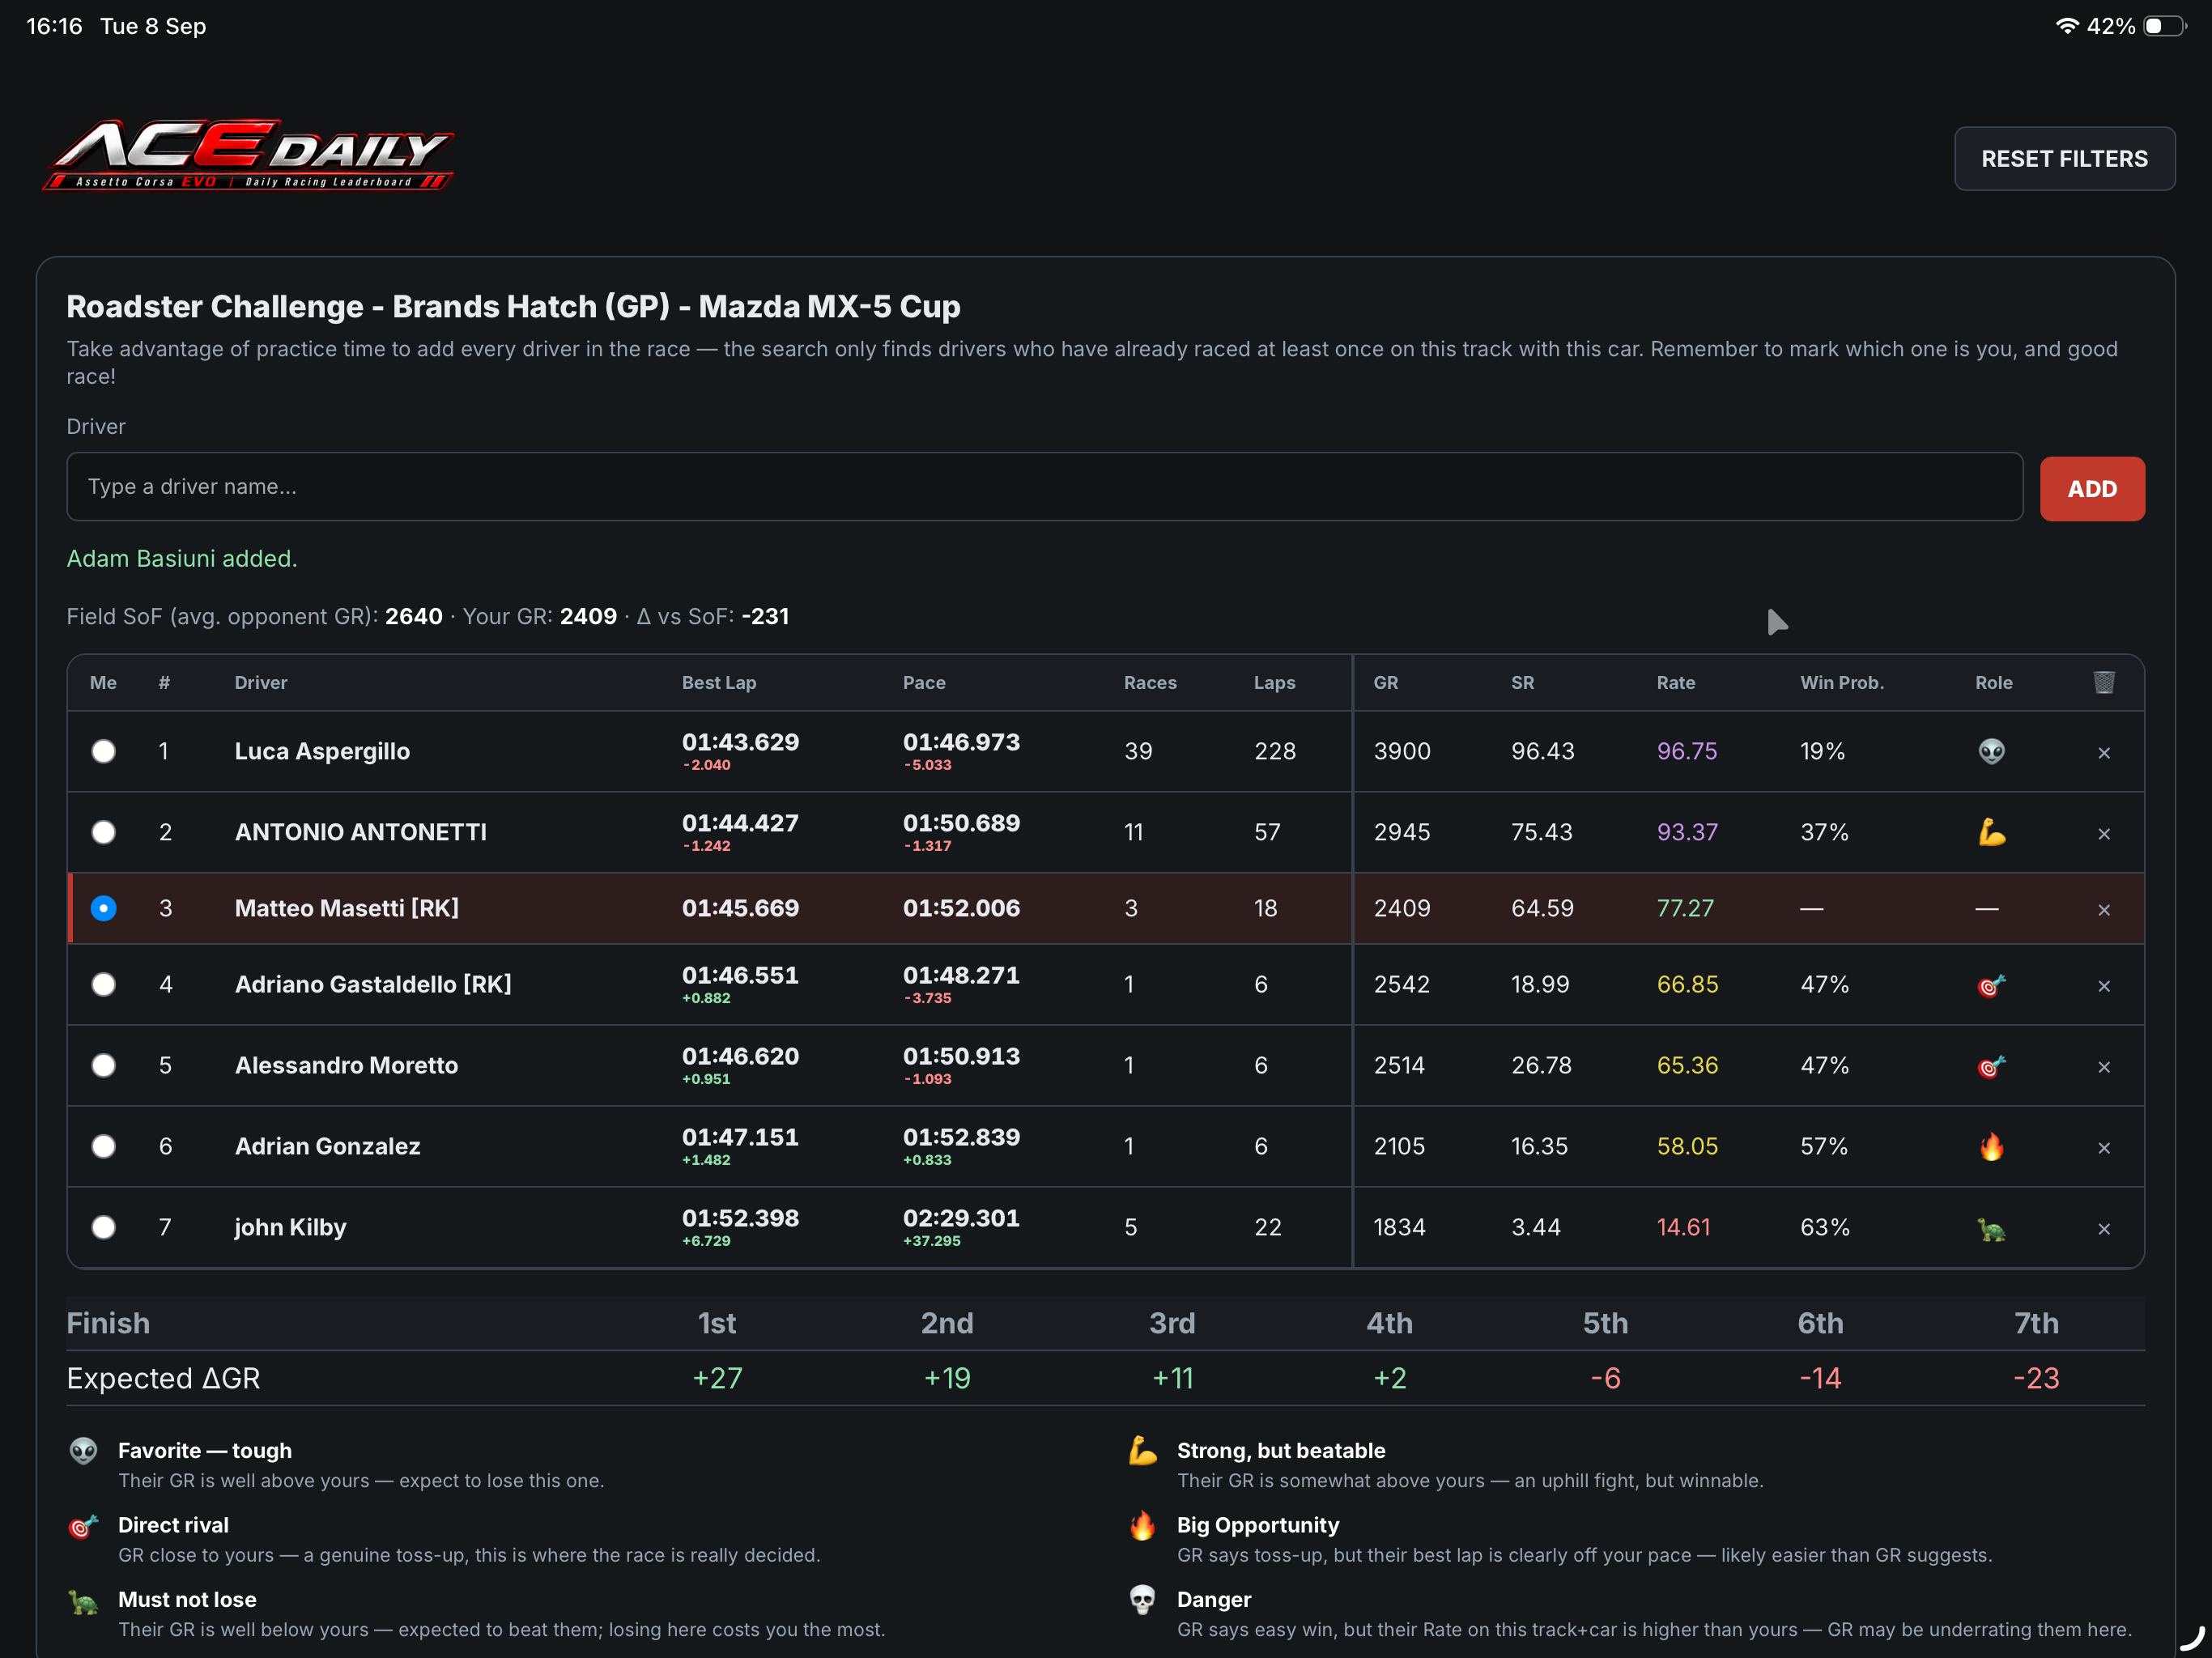
Type each driver's name as you see them show up in practice (the search only finds drivers who have raced this exact track+car combination before) and mark which row is you. The tool only works with history it already has for this specific track+car — it can't see anyone's very first time on it.
Field strength line
Right under the driver search: the field's SoF (Strength of Field — the average Grid Rating of your opponents), your own GR, and the difference between the two.
Table columns
- Best Lap / Pace — this driver's fastest lap and average race pace on this track+car, from their full history. The small number underneath (green if faster than you, red if slower) is the gap to your own time.
- GR / SR — current Grid Rating and Safety Rating.
- Rate — this driver's best-lap percentile on this exact track+car, ranked against everyone who has ever raced it (100 = fastest on record, 0 = slowest). Colour-coded red / yellow / green / purple from low to high, same bands as the Driver Profile matrix.
- Win Prob. — the estimated probability you beat that specific driver, from their Grid Rating alone (see method, below).
- Role — a one-icon read of that match-up (see legend below).
Expected ΔGR table
Underneath the driver table: for every possible finishing position tonight, the Grid Rating change you'd expect at that result. A race with fewer than 6 cars shows a notice instead — SimGrid's own rules mean GR doesn't change at all below that threshold, regardless of the result.
Role icons
How the numbers are calculated
SimGrid doesn't publish its Grid Rating formula. Win Prob. and Expected ΔGR come from a model we reverse engineered ourselves, by statistically analysing roughly 186,000 of our own historical race results against SimGrid's own public rules (the 6-car threshold, the "diminishing gains when far ahead of the field on GR" rule) and cross-checking the result. It's a genuine multiplayer Elo-style model, not a guess — but it explains roughly 46% of the variation we can see (R²≈0.46 against real outcomes), so treat every number here as directional, not as an official prediction.
The 🔥 Big Opportunity and 💀 Danger overrides were separately checked against the same historical data (over 2.6 million pairwise match-ups): within match-ups the base model calls a toss-up, a driver flagged 🔥 actually won 74.2% of the time versus 38.5% when not flagged; within match-ups the base model calls an easy win, a driver flagged 💀 actually won only 44.7% of the time versus 82.2% when not flagged. Best Lap and Rate in this check use each driver's full track+car history, same as the live tool above — not restricted to only what was known before each specific race.
5Driver Profile
One driver's full track record: overall stats, plus how they stack up car by car, track by track.
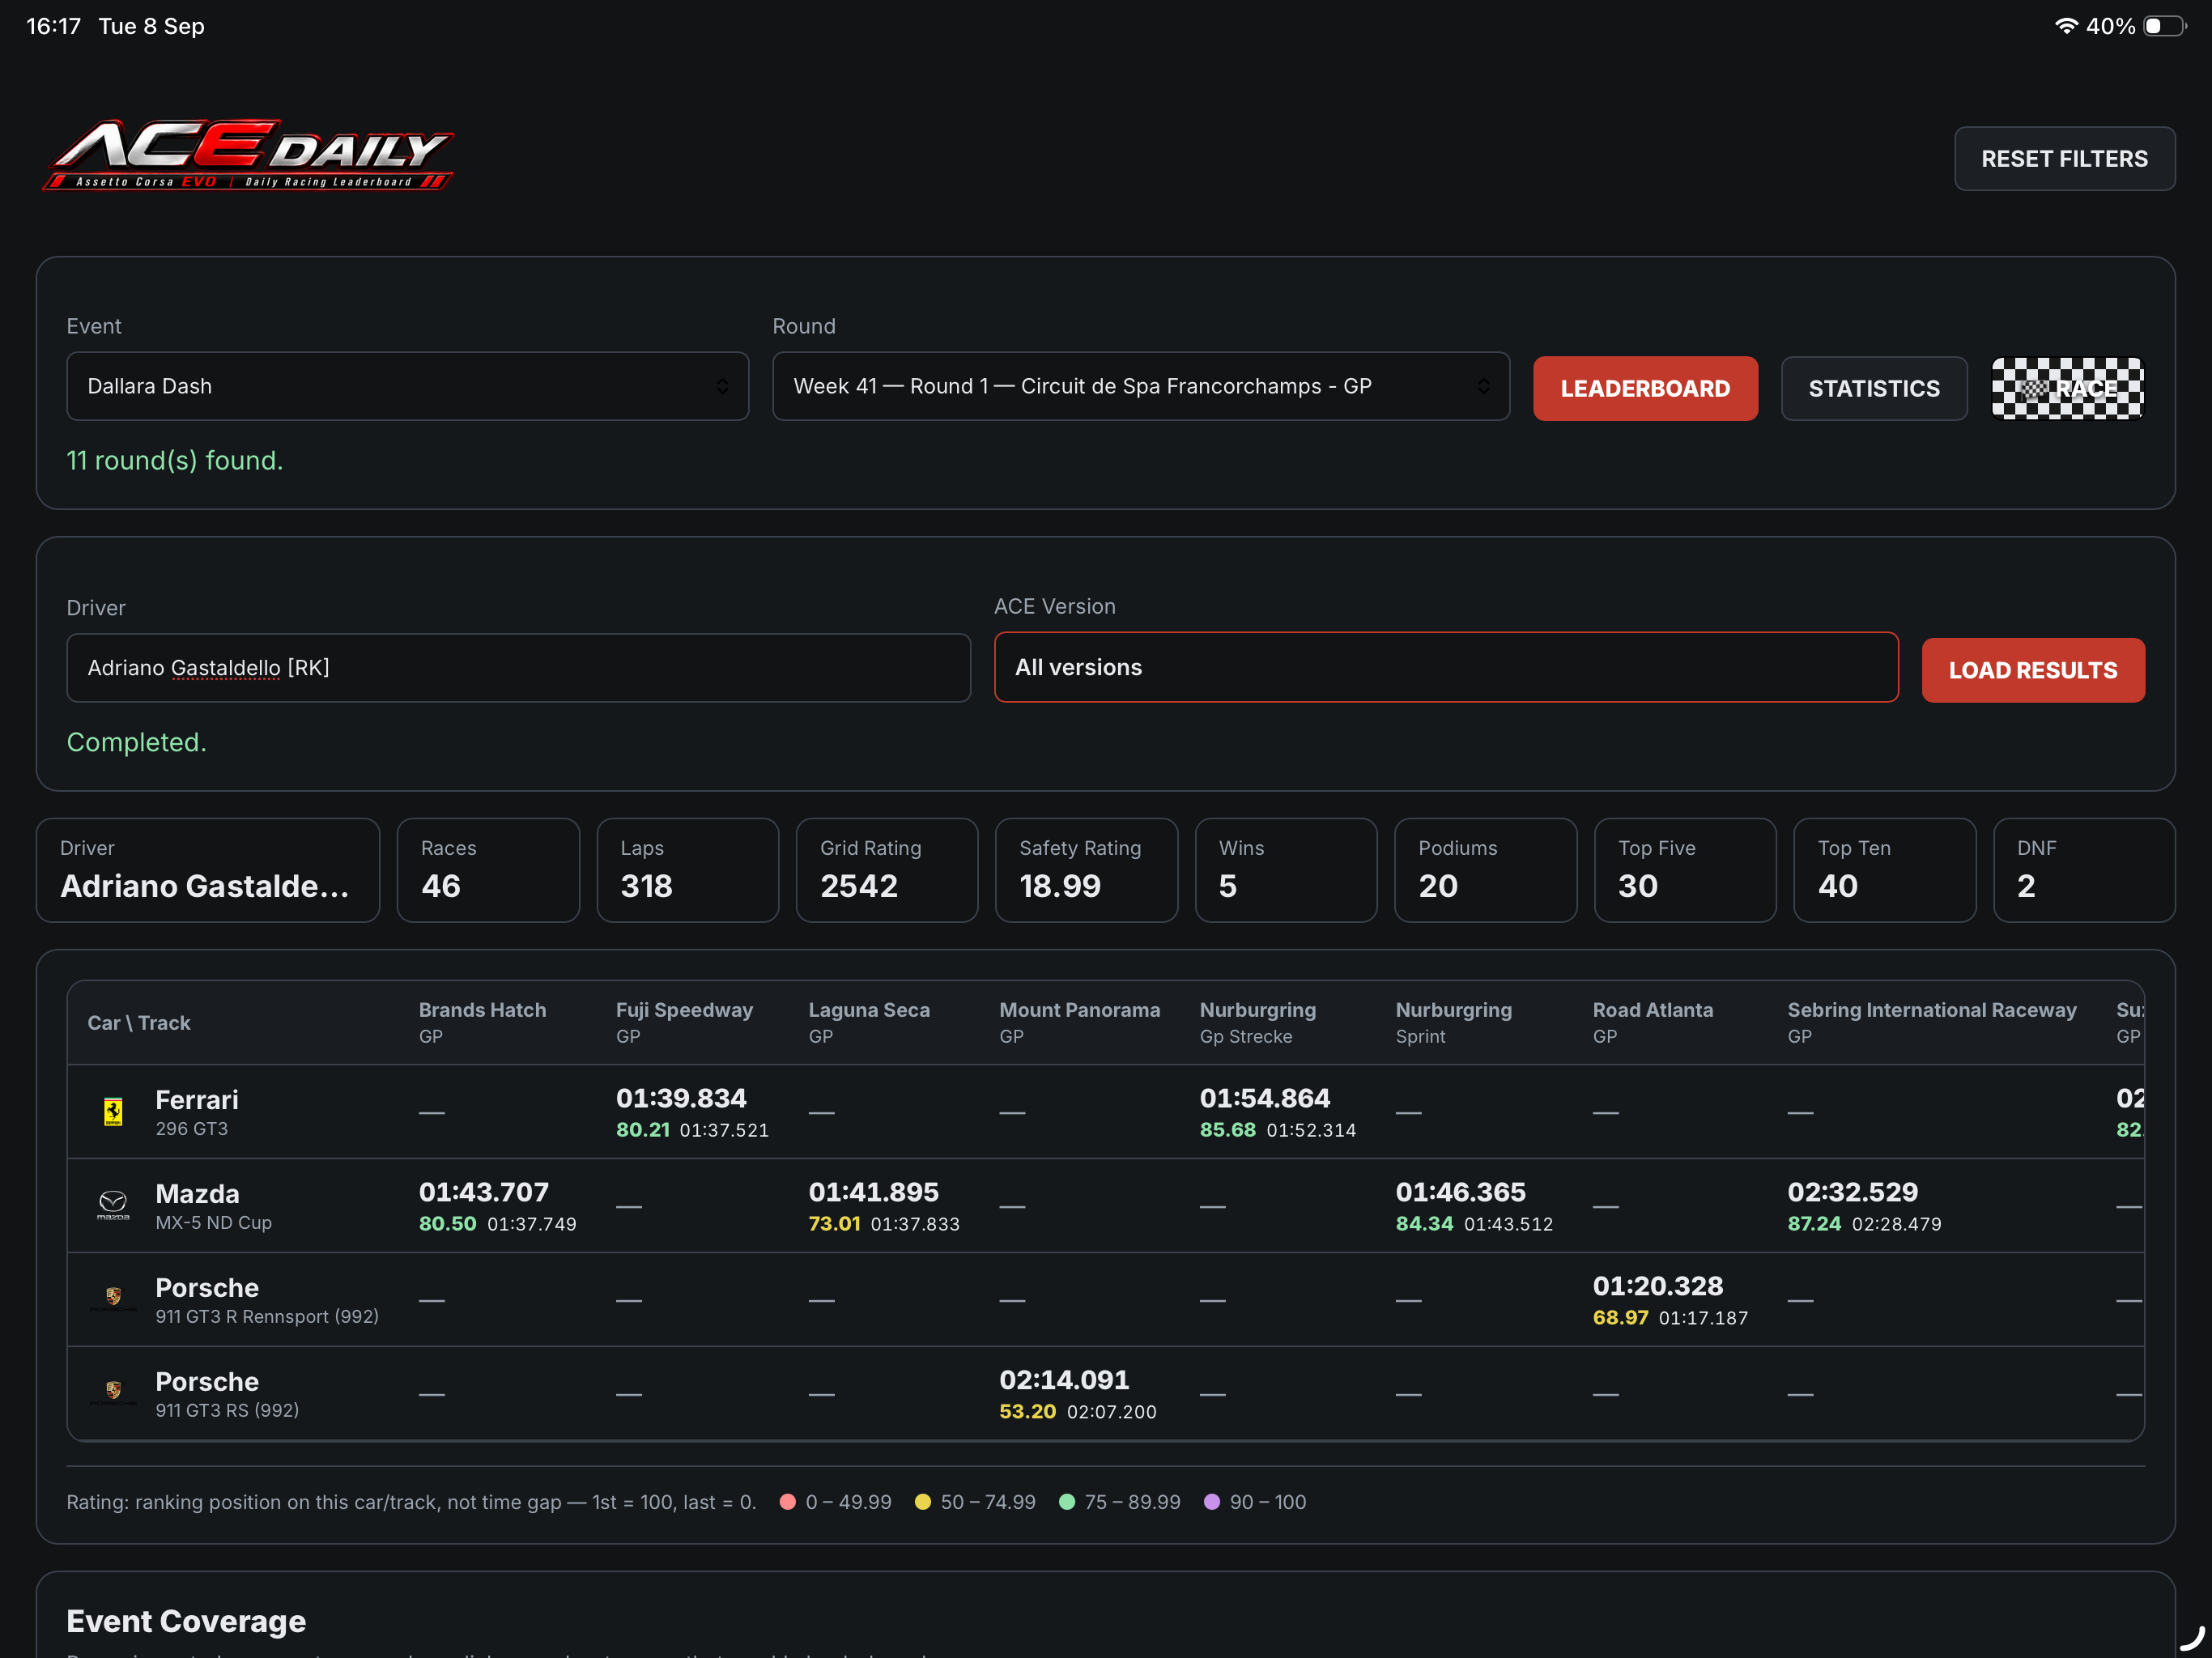
The stat cards give the driver's totals: races, laps, current Grid Rating and Safety Rating, wins, podiums, top-five and top-ten finishes, and DNFs.
The matrix below ranks that driver's best lap, on every car they've driven, against everyone else who has run that same car on that same track. Each populated cell shows the driver's best lap, their percentile rank (colour-coded), and the outright best lap on record for that combination.
The percentile is a ranking position, not a time gap — 1st on that car+track scores 100, last scores 0, regardless of how close or far apart the actual lap times are.
6Event Coverage
How much history we actually have, event by event, week by week.
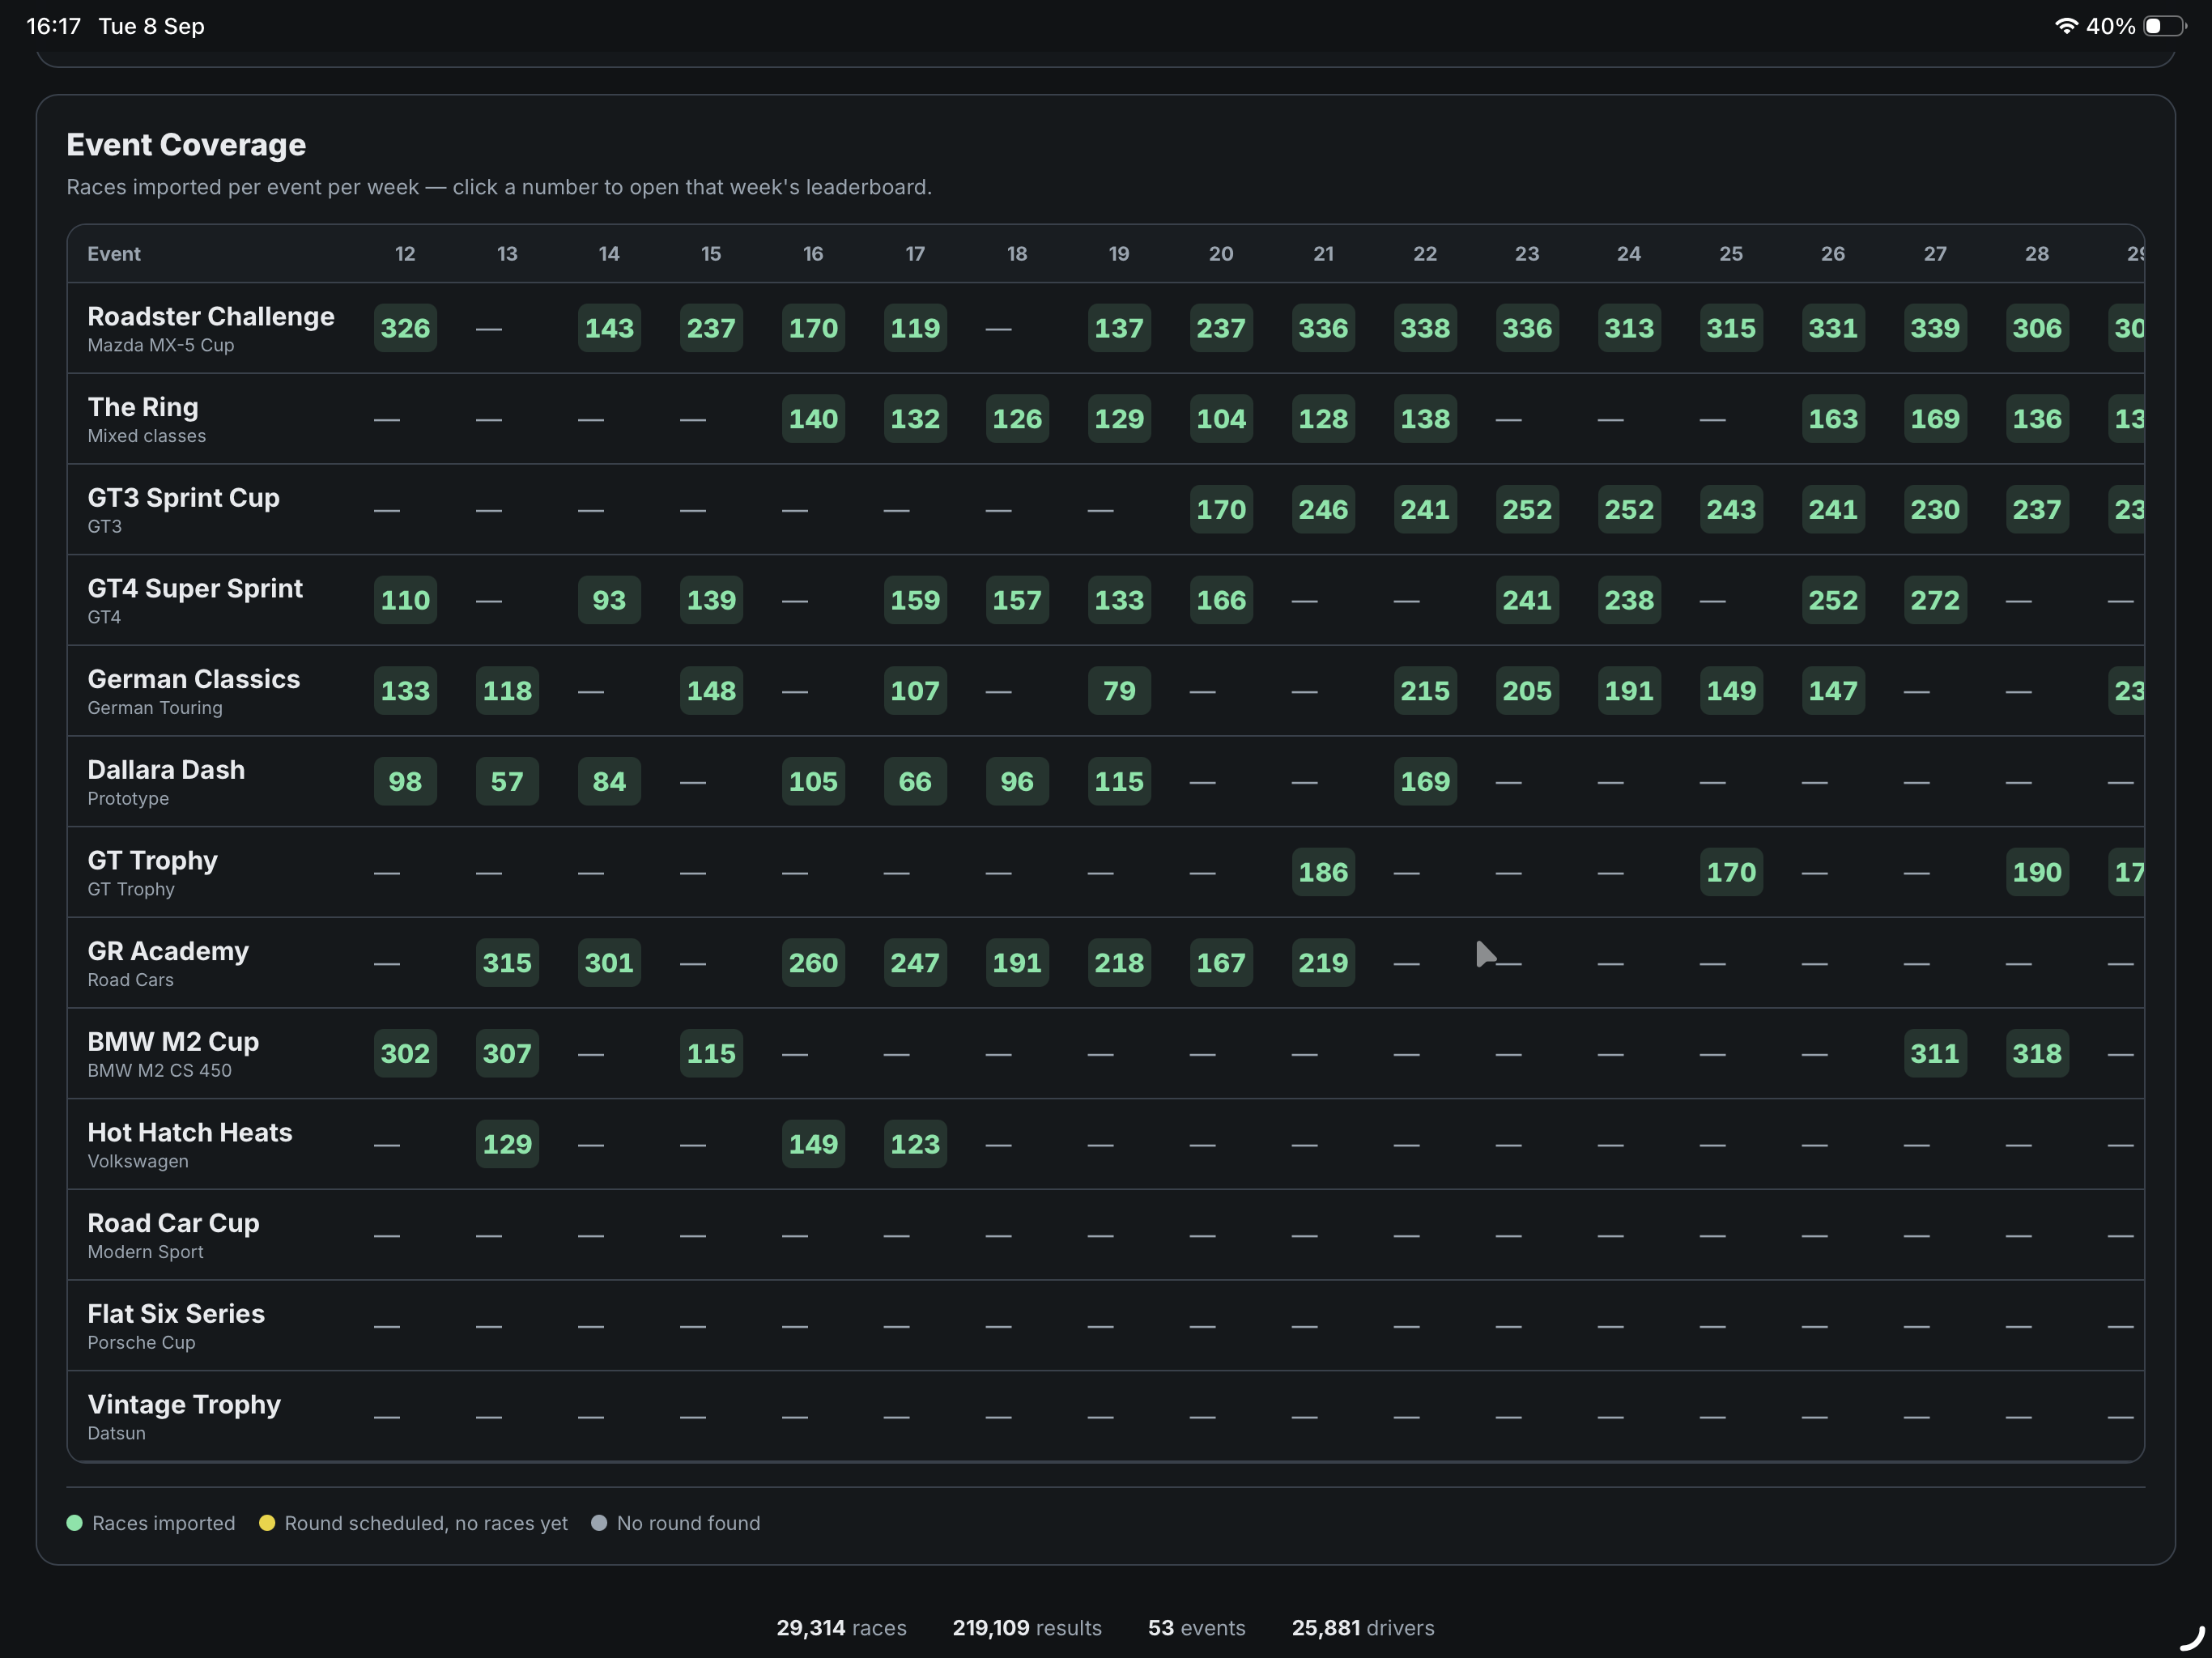
Every row is an event, every column a week number; the number in each cell is how many races were imported that week. Green means races were successfully imported, yellow means a round was scheduled but no races have landed yet, and an empty cell means no round was even found for that event that week. Click any number to jump straight to that week's leaderboard.